Validation Using Quantitative Data
Quantitative validation is the process of using mathematical and statistical techniques to verify that a model is performing as intended. Instead of relying on gut feelings, analysts use "hard data" to test the model's accuracy, logic, and stability. This typically involves running historical data through the model to see if the outputs match known outcomes (backtesting), checking how the model reacts to extreme market shifts (stress testing), and ensuring the underlying code is free of errors. Essentially, it's a rigorous "stress test" for formulas to ensure they remain reliable when real money or decisions are on the line.
| Day | Budget | Impressions | Clicks | Leads | Reservations |
| 1 | $1.86 | 26 | 7 | 1 | 0 |
| 2 | $4.58 | 47 | 29 | 4 | 0 |
| 3 | $10.14 | 431 | 55 | 5 | 0 |
| 4 | $15.45 | 477 | 60 | 7 | 0 |
| 5 | $16.28 | 520 | 69 | 11 | 0 |
| 6 | $19.59 | 581 | 73 | 11 | 0 |
| 7 | $20.95 | 824 | 75 | 12 | 0 |
| 8 | $25.45 | 828 | 82 | 14 | 1 |
| 9 | $26.70 | 1239 | 86 | 14 | 1 |
| 10 | $26.91 | 1321 | 100 | 15 | 1 |
| 11 | $27.19 | 1737 | 113 | 16 | 1 |
| 12 | $36.04 | 1747 | 121 | 20 | 1 |
| 13 | $41.32 | 1789 | 152 | 21 | 1 |
| 14 | $43.45 | 2713 | 155 | 22 | 1 |
| 15 | $54.99 | 2844 | 169 | 24 | 1 |
| 16 | $57.53 | 3107 | 175 | 27 | 1 |
| 17 | $60.19 | 3243 | 178 | 27 | 1 |
| 18 | $66.38 | 3289 | 194 | 27 | 1 |
| 19 | $71.04 | 3381 | 199 | 29 | 1 |
| 20 | $71.17 | 3399 | 200 | 33 | 2 |
| 21 | $72.48 | 3719 | 201 | 33 | 2 |
| 22 | $75.51 | 3995 | 202 | 34 | 2 |
| 23 | $76.12 | 4187 | 213 | 35 | 2 |
| 24 | $77.62 | 4495 | 219 | 36 | 2 |
| 25 | $81.81 | 4544 | 222 | 36 | 2 |
| 26 | $85.57 | 4596 | 230 | 36 | 2 |
| 27 | $93.84 | 4596 | 245 | 37 | 2 |
| 28 | $102.04 | 4603 | 261 | 37 | 2 |
| 29 | $105.24 | 4613 | 275 | 37 | 2 |
| 30 | $110.73 | 4737 | 299 | 38 | 2 |
Analysis
To validate your product using these metrics, you must perform a funnel-down analysis that compares your real-world performance against your target benchmarks. You start at the top of the funnel by assessing creative resonance (CTR) and market cost (CPM), then move to the middle to evaluate landing page conversion (L-CR), and finally calculate the "Bottom Line" by applying your pessimistic, realistic, and optimistic purchase probabilities to your Lead and Reservation totals. Validation occurs when the Realistic eROAS (Estimated Return on Ad Spend) is calculated by multiplying your total projected conversions by the product price and dividing it by the Ad Spend; if that figure exceeds 200%, the product is quantitatively "validated."
The Result
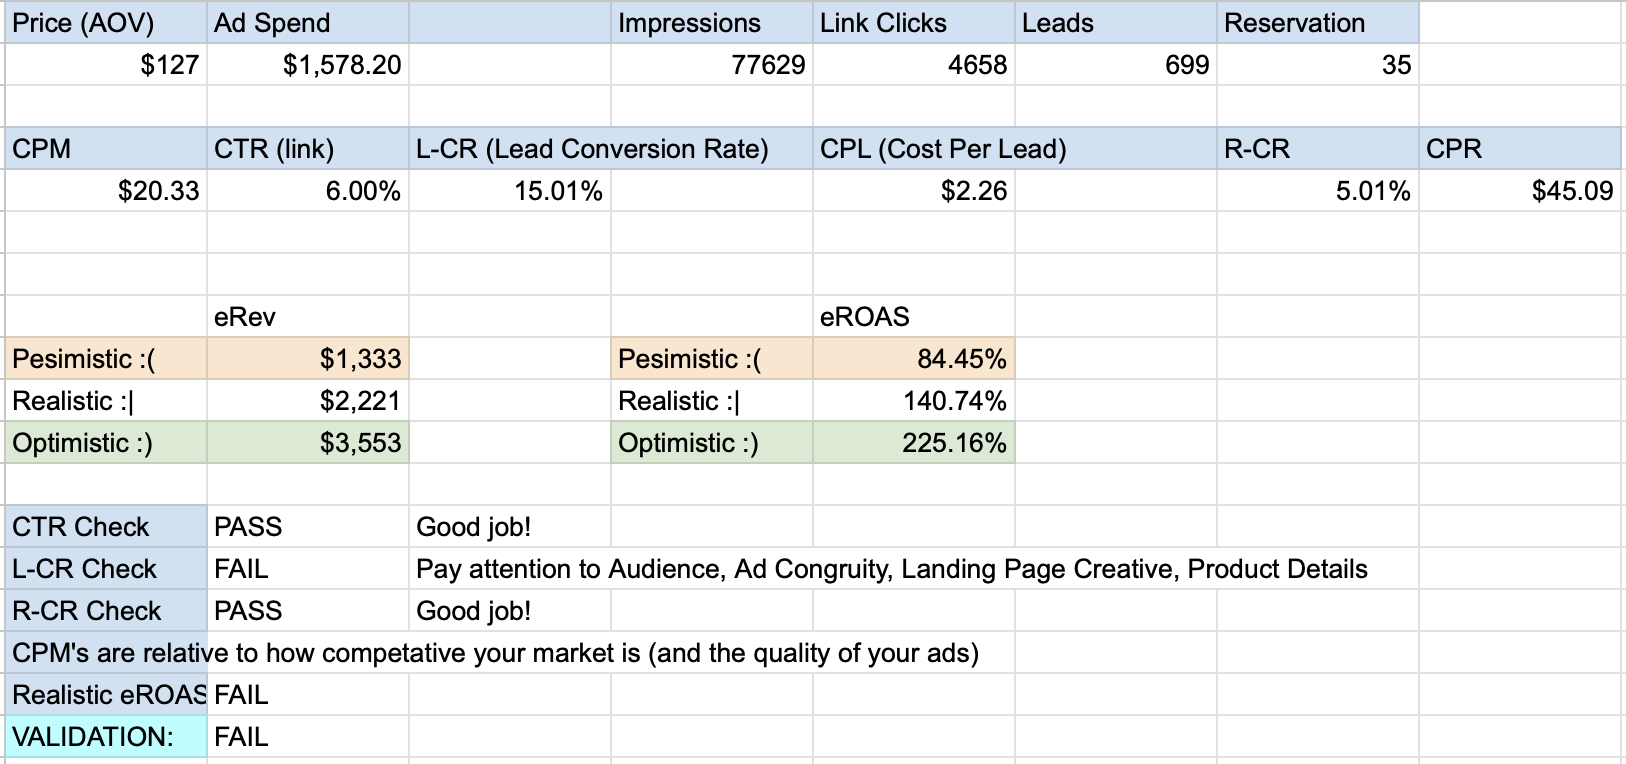
Key Terms
- Budget
- The amount of money allocated to spend on that day for marketing
- Impressions
- The total amount of the times the ad appeared
- Clicks
- The number of times users actually interacted with the ad
- Leads
- Potential customers who shared their contact info or showed direct interest
- Reservations
- Confirmed bookings or saved spots, usually representing a final conversion