Information about Stock Market Trends
In the modern financial era, the stock market is essentially a digital marketplace where ownership in companies is traded as "shares." For the motivated consumer, this marketplace is supported by a vast ecosystem of data that can be used to forecast economic health and individual company performance.
When you visit a financial website, you are looking at more than just numbers—you are looking at a story of supply, demand, and sentiment. The primary types of data available include:
- Fundamental Data: This includes revenue, profit margins, and debt levels. Insight: By looking at a company’s "P/E Ratio" (Price-to-Earnings), a consumer can determine if a stock is "expensive" compared to its peers.
- Technical Data: Price charts and volume. Insight: High trading volume during a price increase suggests strong institutional "conviction," whereas a price spike on low volume may be a "trap."
- Macro Indicators: Inflation rates and bond yields. Insight: When the 10-Year Treasury Yield rises, tech stocks (like those on the Nasdaq) often drop because their future profits become less valuable in today's dollars.
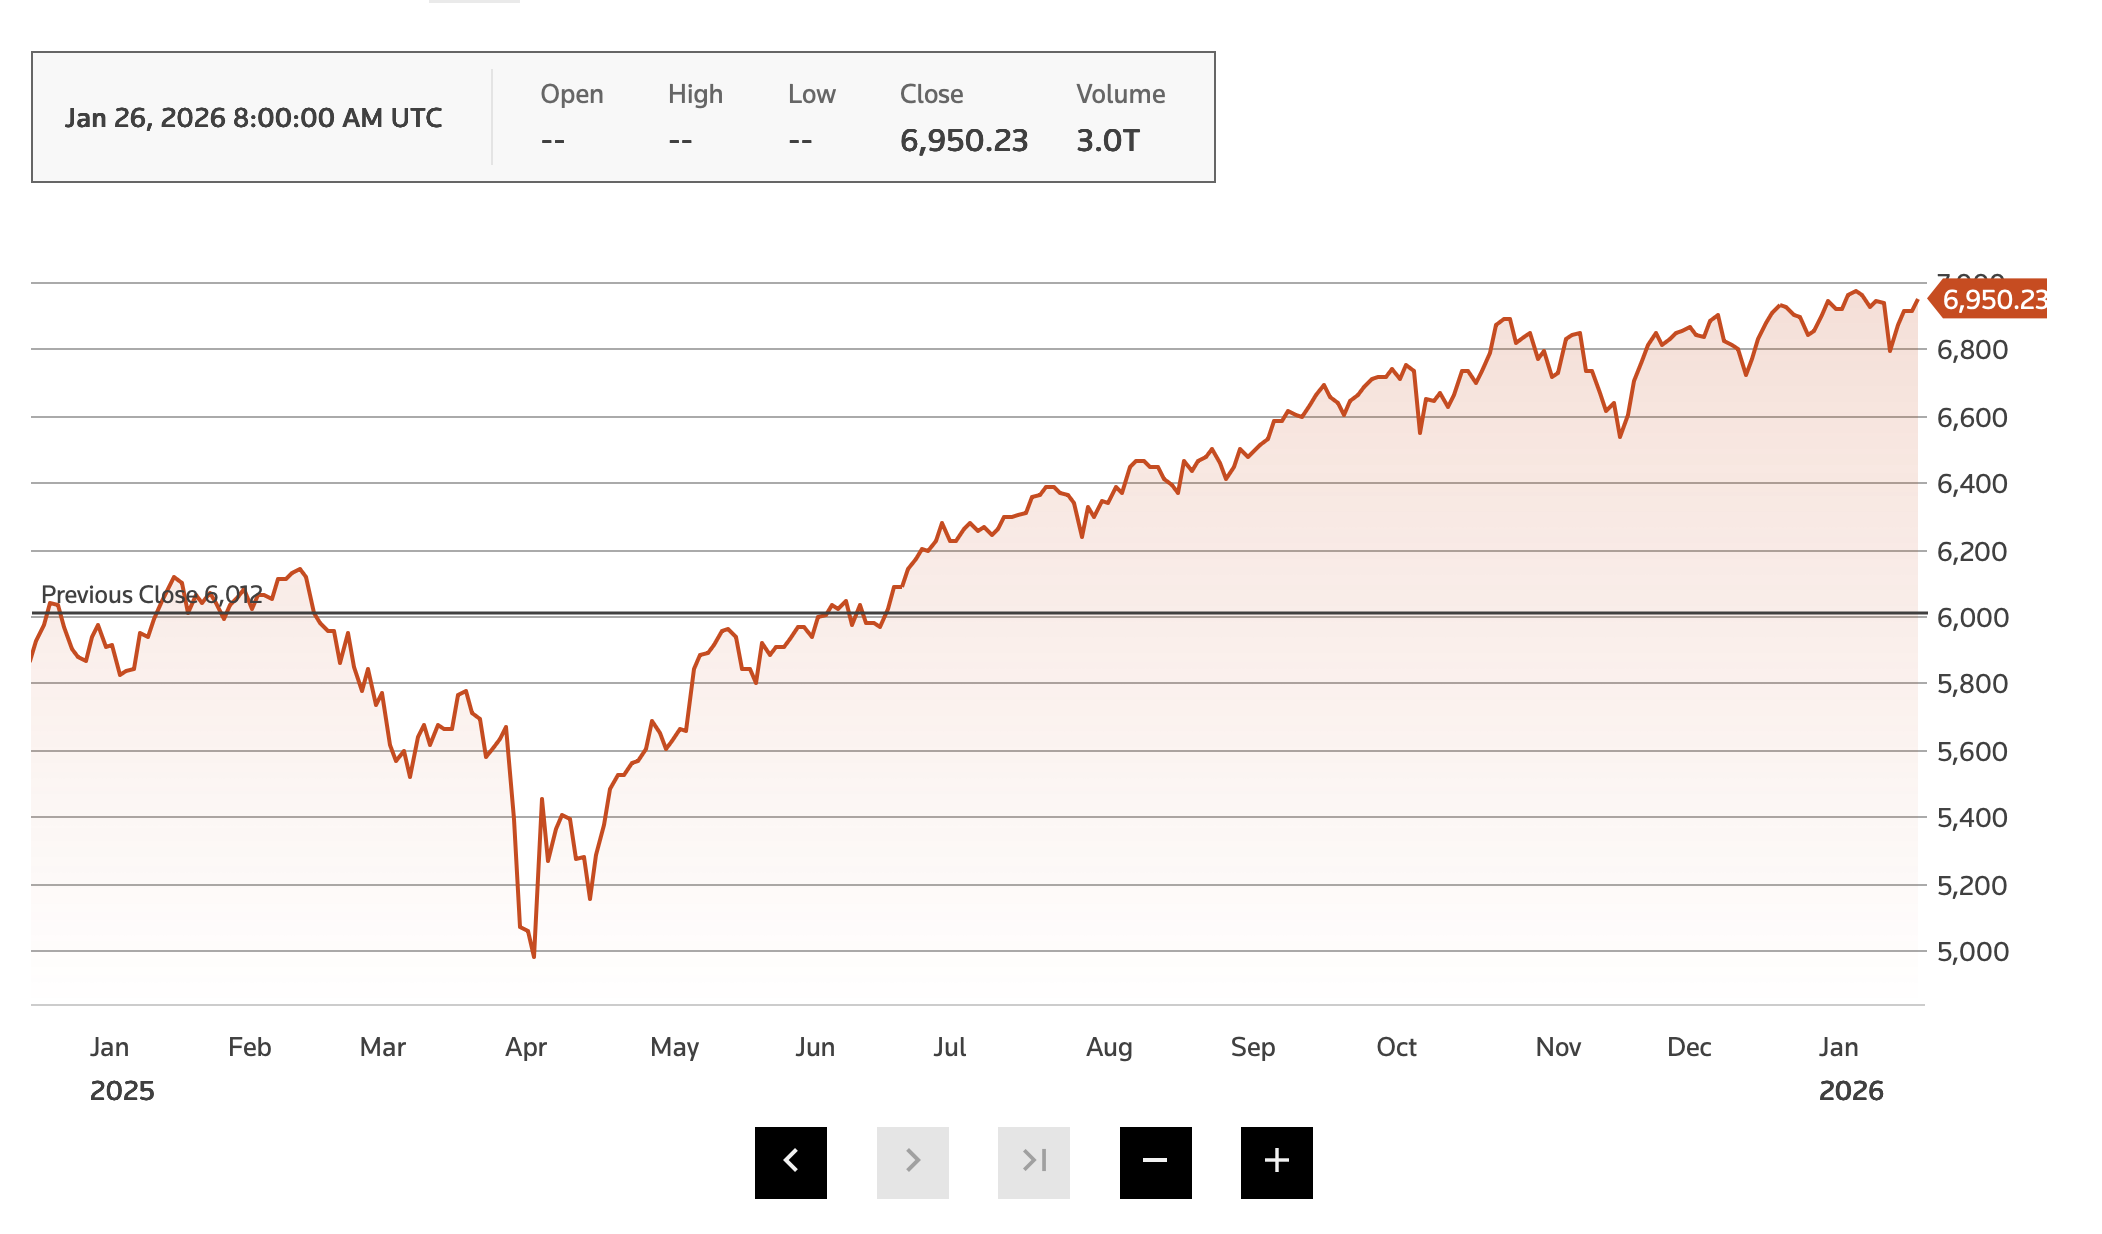
An index functions as a high-level economic barometer that summarizes the collective health of hundreds of companies into a single, scannable value. By analyzing an index, a motivated consumer can identify market breadth—essentially seeing whether a rally is supported by many healthy companies or just a few tech giants—and gauge investor sentiment, where a rising Nasdaq suggests a "risk-on" appetite for growth while a steady Dow indicates a flight to "defensive" safety. Furthermore, tracking an index allows one to spot sector rotation, providing the critical insight that money is moving out of one industry, like energy, and into another, like healthcare, which serves as a leading indicator for where the next economic growth cycle may begin.
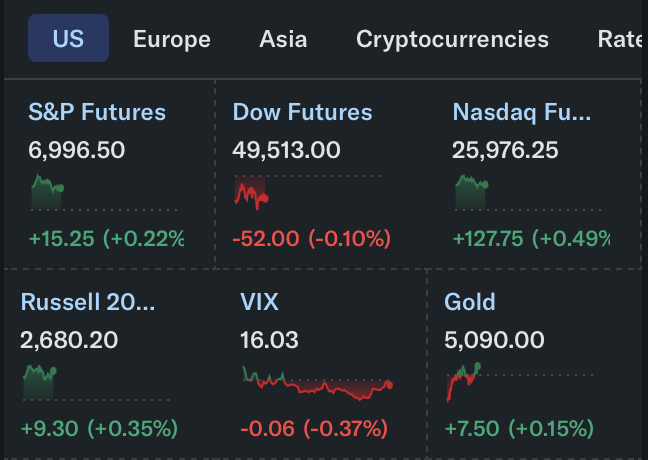
In early 2026, the stock market has transitioned into a "Data Area" where geopolitical headlines and corporate earnings have become inseparable. For the motivated consumer, these digital spaces are no longer just for tracking prices; they are tools for decoding shifts in the global economy. By synthesizing data from sources like MarketWatch, LiveMint, and Yahoo Finance, an investor can move beyond the "what" of market movements to understand the "why," identifying whether a dip is a temporary reaction to a headline or a structural shift in how capital is being allocated across the Dow, S&P 500, and Nasdaq.
-
MarketWatch - Stock Market Data

-
LiveMint (Financial News)

-
Yahoo Finance

Sample Analysis Walkthrough To draw actionable knowledge from these resources, a user should follow a three-step cross-referencing process. First, start with LiveMint to identify the "Main Story" (e.g., "Fed Meeting Looms Amid Greenland Tensions"). If the news is negative, move to MarketWatch to see which specific sectors are "bleeding" versus which are "holding the line." If the Nasdaq is down 2% but the Dow is flat, you’ve identified a tech-specific sell-off. Finally, verify the health of the recovery on Yahoo Finance by checking the RSI (Relative Strength Index) on the indices. If the RSI is below 30 while the "Equal Weight" index remains steady, it suggests an "oversold" condition for tech that might actually be a buying opportunity, rather than a reason to panic.