Validation Using Quantitative Data
Data Table
| Day | Budget | Impressions | Clicks | Leads | Reservations |
| 1 | $1.86 | 26 | 7 | 1 | 0 |
| 2 | $4.58 | 47 | 29 | 4 | 0 |
| 3 | $10.14 | 431 | 55 | 5 | 0 |
| 4 | $15.45 | 477 | 60 | 7 | 0 |
| 5 | $16.28 | 520 | 69 | 11 | 0 |
| 6 | $19.59 | 581 | 73 | 11 | 0 |
| 7 | $20.95 | 824 | 75 | 12 | 0 |
| 8 | $25.45 | 828 | 82 | 14 | 1 |
| 9 | $26.70 | 1239 | 86 | 14 | 1 |
| 10 | $26.91 | 1321 | 100 | 15 | 1 |
| 11 | $27.19 | 1737 | 113 | 16 | 1 |
| 12 | $36.04 | 1747 | 121 | 20 | 1 |
| 13 | $41.32 | 1789 | 152 | 21 | 1 |
| 14 | $43.45 | 2713 | 155 | 22 | 1 |
| 15 | $54.99 | 2844 | 169 | 24 | 1 |
| 16 | $57.53 | 3107 | 175 | 27 | 1 |
| 17 | $60.19 | 3243 | 178 | 27 | 1 |
| 18 | $66.38 | 3289 | 194 | 27 | 1 |
| 19 | $71.04 | 3381 | 199 | 29 | 1 |
| 20 | $71.17 | 3399 | 200 | 33 | 2 |
| 21 | $72.48 | 3719 | 201 | 33 | 2 |
| 22 | $75.51 | 3995 | 202 | 34 | 2 |
| 23 | $76.12 | 4187 | 213 | 35 | 2 |
| 24 | $77.62 | 4495 | 219 | 36 | 2 |
| 25 | $81.81 | 4544 | 222 | 36 | 2 |
| 26 | $85.57 | 4596 | 230 | 36 | 2 |
| 27 | $93.84 | 4596 | 245 | 37 | 2 |
| 28 | $102.04 | 4603 | 261 | 37 | 2 |
| 29 | $105.24 | 4613 | 275 | 37 | 2 |
| 30 | $110.73 | 4737 | 299 | 38 | 2 |
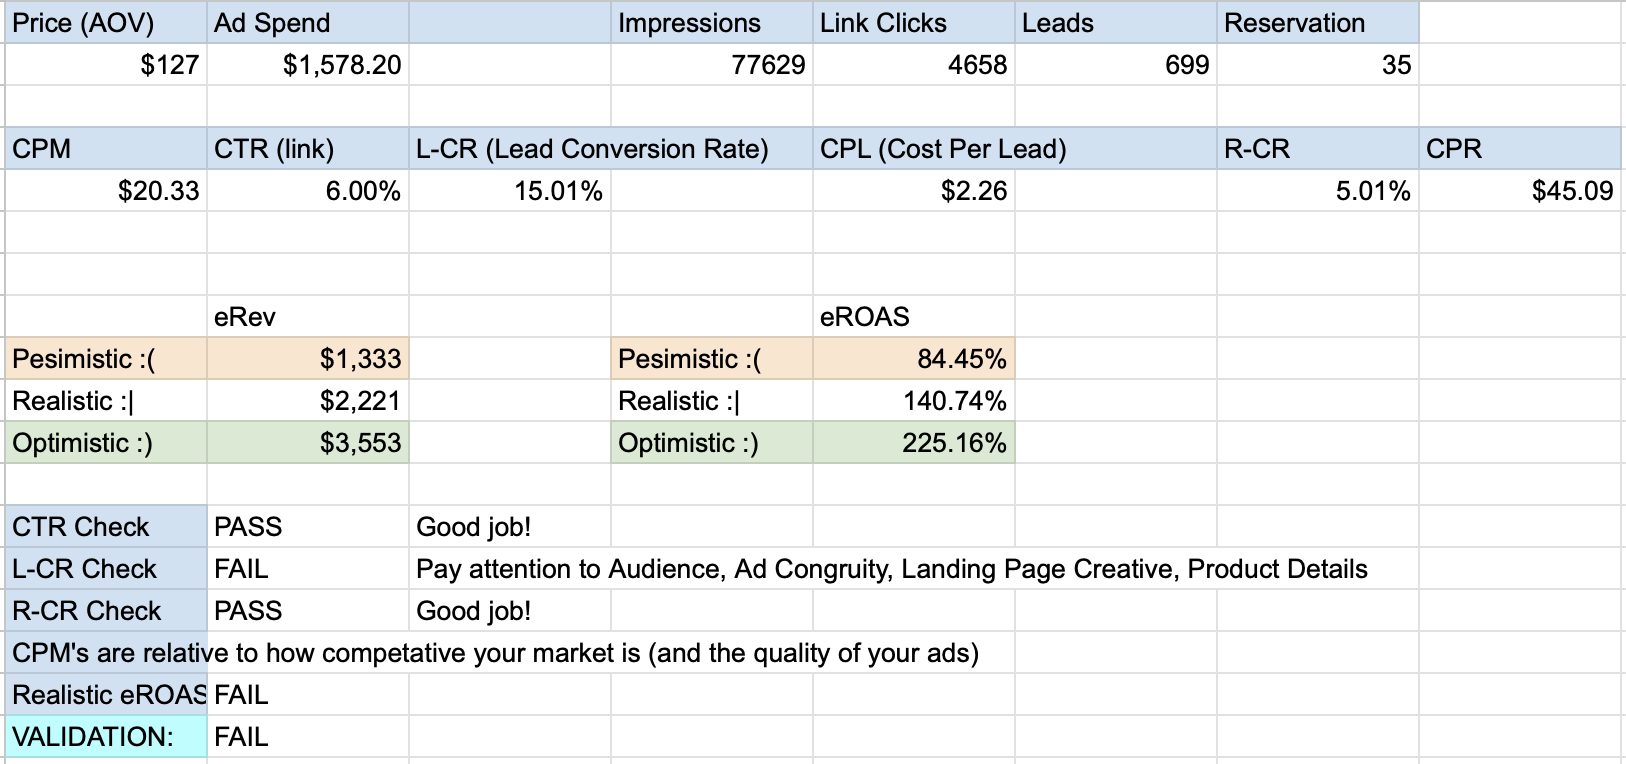
Analysis
To validate your product using these metrics, you must perform a funnel-down analysis that compares your real-world performance against your target benchmarks. You start at the top of the funnel by assessing creative resonance (CTR) and market cost (CPM), then move to the middle to evaluate landing page conversion (L-CR), and finally calculate the "Bottom Line" by applying your pessimistic, realistic, and optimistic purchase probabilities to your Lead and Reservation totals. Validation occurs when the Realistic eROAS (Estimated Return on Ad Spend) is calculated by multiplying your total projected conversions by the product price and dividing it by the Ad Spend; if that figure exceeds 200%, the product is quantitatively "validated."In this case, the validation failed because of the calculation results